

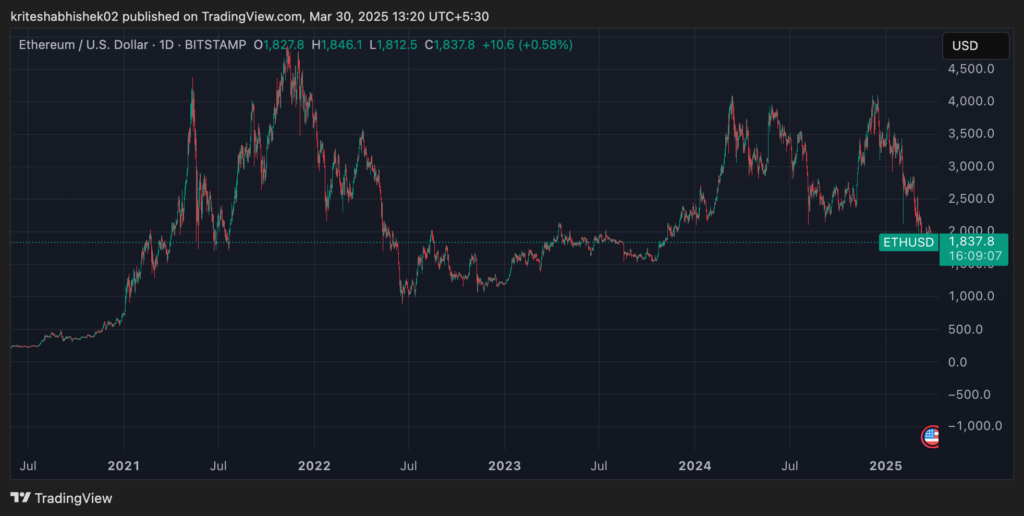
Ethereum, the second-largest cryptocurrency by market capitalization, has witnessed a massive price correction from its all-time high of around $4,878 in November 2021. As of March 30, 2025, Ethereum is trading near $1,837.8 — a staggering 62.33% drop from its peak.
This sharp decline has reignited a key question for investors and traders alike: Is now the right time to enter Ethereum? Or is there more downside risk ahead? In this article, we take a deep dive into Ethereum’s price action, key technical levels, and trends to understand what the charts are really telling us.

📈 The Late 2024 – Early 2025 Rally: A Sharp But Short-Lived Surge
Before diving into the ongoing correction, it’s worth highlighting Ethereum’s impressive rally in the last quarter of 2024 and the beginning of 2025. During this period, ETH made a swift move from around $1,600 to nearly $3,900, gaining over 140% in just a few months.
This bullish momentum was fueled by multiple factors, including:
- Renewed optimism around crypto regulation
- Uptick in institutional inflows
- Ethereum ecosystem upgrades and increasing Layer-2 adoption
- General bullish sentiment across the broader crypto market
However, the rally turned out to be short-lived. After peaking near $3,900 in early 2025, Ethereum faced strong resistance and selling pressure, which eventually led to a reversal. Since then, the price has steadily declined, pulling back below the key $2,000 mark — signaling the end of the mini bull phase and reintroducing bearish sentiment.
📉 A Quick Look at Ethereum’s Price Journey
Ethereum experienced a historic bull run from mid-2020 to late 2021, skyrocketing from under $200 to nearly $4,878 within 18 months. This rally was driven by the rise of DeFi, NFTs, and Ethereum’s dominance as a smart contract platform.
However, since its peak, the crypto market has entered a prolonged correction phase. Ethereum, much like Bitcoin and other altcoins, has faced intense volatility amid global macroeconomic challenges and regulatory uncertainty.
As of now, Ethereum has crashed more than 62% from its ATH, and is hovering near a crucial support zone, sparking fresh debates around whether this is a buy-the-dip opportunity or a falling knife.
🧭 Long-Term Trend: Bearish with Caution
From a macro technical perspective, Ethereum remains in a long-term downtrend. After its November 2021 top, ETH has consistently formed lower highs, failing to reclaim bullish momentum despite temporary rallies.
The most recent price structure shows that ETH has struggled to sustain moves above $3,000, facing repeated rejections at $3,200, $3,600, and $4,000. This suggests that the bulls have yet to regain full control.
Currently, ETH is still trading below the 200-day moving average (a key long-term trend indicator), which points to continued bearish pressure unless we see a confirmed reversal above $2,400.
🔎 Short-Term Trend: Weakness Persists
Zooming into the short-term (daily chart), Ethereum is clearly in a downtrend, forming lower highs and lower lows since January 2025.
After failing to break above the $2,100 resistance, Ethereum slid back toward the $1,800–$1,700 support zone. This region has acted as a critical base multiple times before, and the current price action is testing investor sentiment yet again.
If ETH manages to hold this support, a short-term bounce is possible. However, a breakdown below $1,700 could trigger another leg down toward $1,400.
🔑 Key Support and Resistance Levels
✅ Support Zones
- $1,700–$1,800 – Crucial support zone currently being tested.
- $1,400 – Major support from the 2022 bear market base.
- $1,050–$1,100 – Multi-year low, could act as a worst-case scenario floor.
❌ Resistance Zones
- $2,000–$2,100 – Immediate psychological resistance.
- $2,400 – Breakout level that could flip the long-term trend.
- $3,000–$3,200 – Strong resistance from previous rally highs.
⚖️ Should You Buy Ethereum Now?
The answer hinges on your risk appetite and investment horizon.
🟢 For Long-Term Investors
If you’re bullish on Ethereum’s future — with ETH 2.0 developments, its role in DeFi, NFTs, and smart contracts — then this 62%+ dip could be a solid long-term entry point, especially near key technical supports.
Using a dollar-cost averaging (DCA) approach can reduce volatility risk and help build a position gradually without timing the exact bottom.
🔴 For Short-Term Traders
ETH is still in a downtrend. Any short-term bullish setups would require ETH to reclaim $2,000–$2,100 convincingly. Until then, bounces might be met with selling pressure.
If Ethereum breaks below $1,700, a fall to $1,400 or lower is not off the table — so short-term caution is advised.
💡 Conclusion: Wait for Confirmation or Accumulate Gradually
Ethereum’s 62.33% drop from its all-time high has pushed it back into attractive valuation territory for long-term investors. However, from a technical standpoint, the trend remains cautious, and confirmation of a trend reversal is yet to come.
If you’re planning to buy ETH, consider accumulating near strong support zones and watching for a breakout above $2,400 for confirmation of a new bullish phase.
Whether Ethereum bounces or dips further, staying informed and disciplined with your strategy can help you navigate the market with confidence.

