

Following last week’s rally in the cryptocurrency market, this week’s macro data releases and Bitcoin’s surge to over $97,000 have led analysts to believe that looser monetary policies in the United States could benefit Bitcoin and other major cryptocurrencies. With momentum gradually building, a continuation of a steady upward trend is anticipated in the upcoming sessions, allowing major coins to reach new highs and breach key psychological levels.
In this overview, we will analyse the key technical levels and trend directions for Bitcoin, Ethereum, and Solana to monitor in the upcoming trading sessions. Bitcoin is currently trading at approximately $97,000. Ethereum is priced at $1,840, while Solana is experiencing significant flatness, currently priced at $150. Overall, most cryptocurrencies are displaying a sideways trend, mirroring the performance of major coins.

Now let’s understand the key support and resistance levels of Bitcoin, Ethereum and Solana and discuss the potential trading strategies for the next trading session. All charts mentioned below are based on the 30-minute timeframe.
Bitcoin Chart Analysis & BTCUSD Price Action.
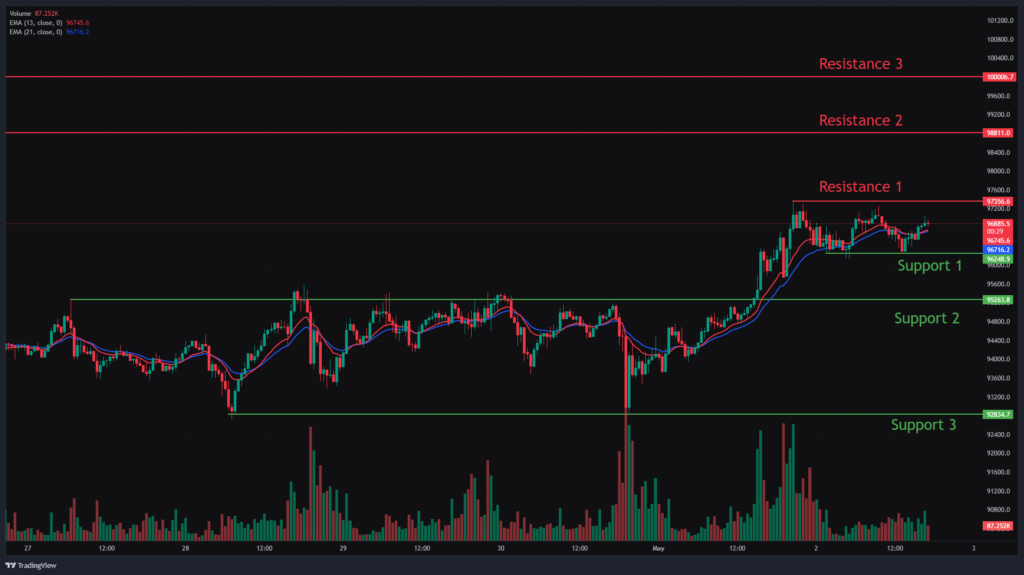
Bitcoin is currently trading around $97,000 with a first level of support at $96,248. If the price manages to break this level, we can see a downfall to the next support at $95,263, and a decline in price below this level will push the price to fall to the price level at 92,834.
On the upside, we can see in the chart that the first level of resistance is at $97,356, followed by the next resistance at $98,811 and $100,000. If the price manages to break above this level, we can observe a good price movement upside. As the 2nd resistance level is broken, we can observe the strong bullish movement.
Ethereum Chart Analysis & ETHUSD Price Action.
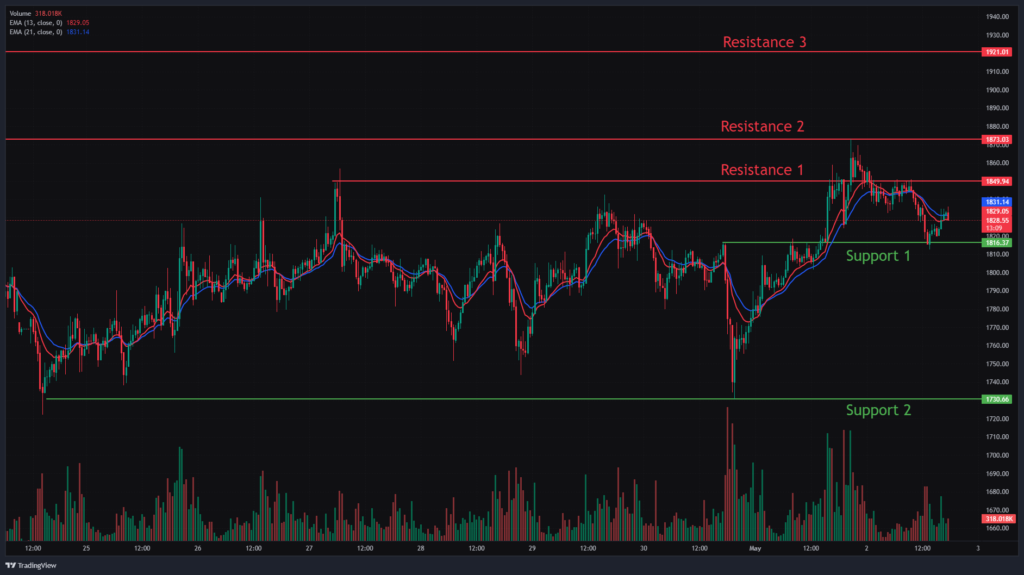
Ethereum is testing the level of $1,820 in the last 24 hours and trying to find strong support for it, which is currently priced at $1,840. If the price manages to break below the first level of support at $1,8160, we can observe the price moving towards the next price level at $1,730. Also, if price manages to break the second level, we can observe a further downside.
On the upside, we can see resistance to the price action at levels $1,850, $1,873, and $1,921. If the price of Ethereum manages to break the first level of resistance, we can see further upside.
Solana Chart Analysis & SOLUSD Price Action.
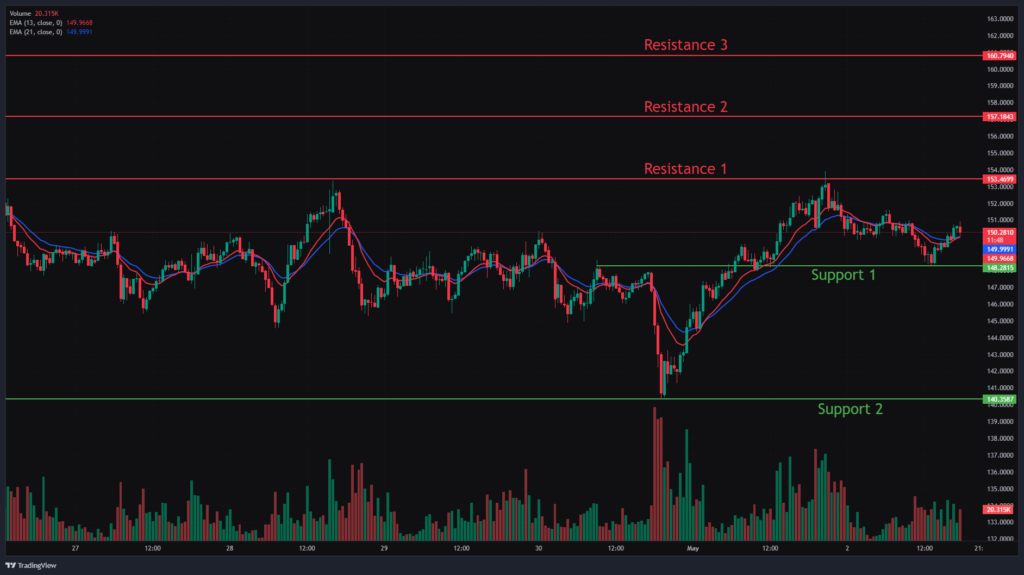
Solana’s price had seen a strong uptrend price action in April but is presently trading flat in previous trading sessions. The coin is presently priced at $150. If the price manages to break the first level of support at $148.2, we can see a bearish trend. The next level of support is observed at $140.3. If the price fails to hold this level, we can observe a free fall to more downside.
On the upside movements, we can observe key resistance levels at $153.4, $157.18 and $160.79. If price manages to break the first resistance levels, we can observe further price movements to the next resistance levels.
Trade setup Summary.
Currently, the cryptocurrency market appears to be experiencing a sideways trend. If key psychological levels are retested, we could see a more bullish momentum in the upcoming trading sessions.
If the price of the cryptocurrency successfully breaks through these resistance levels, we can anticipate a stronger upward trend. However, if the resistance levels remain intact, the market may shift into a bearish trading session.
Traders should consider these key levels to enter long or short positions following the price break from the key levels. Also, traders can combine moving averages for more accurate entry and exit points.
Note: Our Daily Crypto Market Analysis and Trade Setup is published every day at 6:00 PM IST on 72crypto.Com.

