

Crypto market rallied after Trump announced a 90-day pause on tariffs, supported by Bitcoin, Ethereum, Solana, and other cryptocurrencies. The bulls pushed major cryptocurrencies above key resistance levels, providing a brief recovery for investors following the previous decline. We shall understand the price action, key support & resistance levels and trading strategies of Bitcoin, Ethereum, and Solana in detail, along with charts.
Currently, bitcoin has moved by 7.8% and is trading around $82,000. Ethereum has moved by 11.14% and is currently trading at $1,589, and Solana moved up to $113.5 by 11.92% %. The broader cryptocurrency market is in green in the last 24 hours.
Now let’s understand the key support and resistance levels of Bitcoin, Ethereum and Solana and discuss the potential trading strategies for the next trading session. All charts mentioned below are based on the 15-minute timeframe.

Bitcoin Chart Analysis & BTCUSD Price Action.
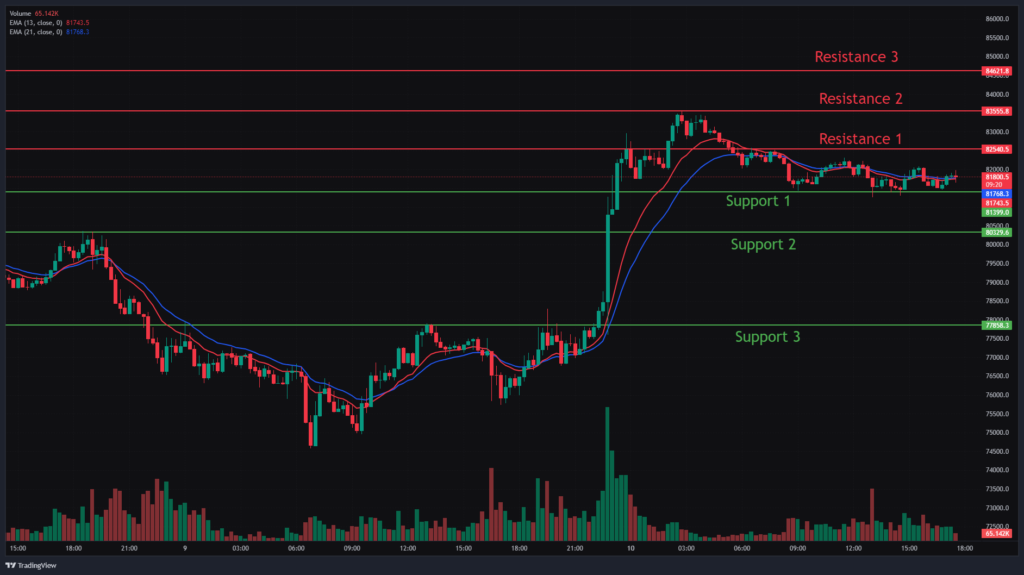
Bitcoin is currently trading around $82,000 with an immediate first level of support at $81,399. If the price manages to break this level, we can see a downfall to the next support at $80,329, and a decline in price below this level will push the price to fall to the price level at 77,858.
On the upside, we can see in the chart that the first level of resistance is at $82,540. If the price manages to break above this level, we can observe a good price movement upside. The next resistance zone to watch is at $83,555 and $84,621, as it is marked.
Ethereum Chart Analysis & ETHUSD Price Action.
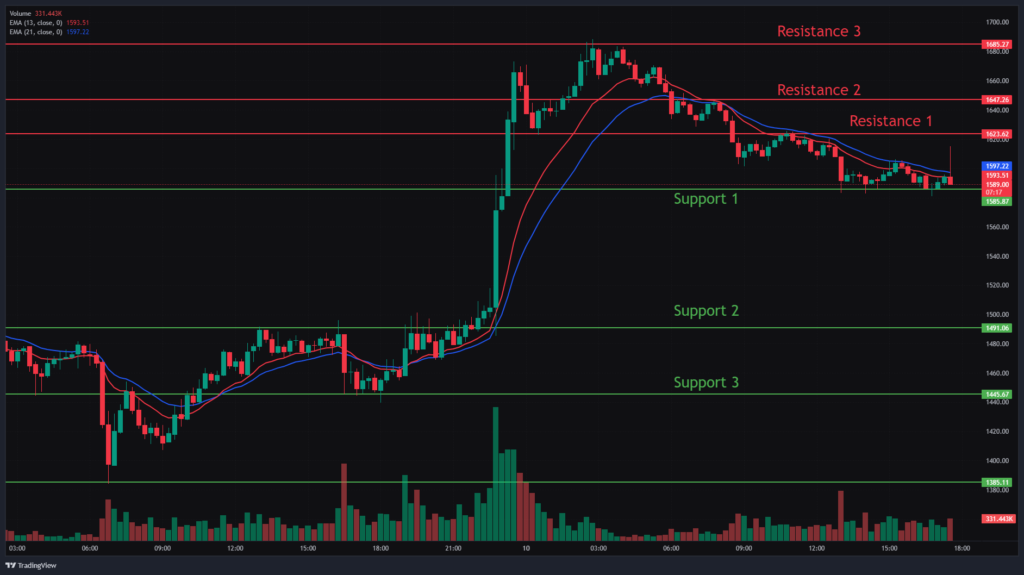
Following the Bitcoin movement the Ethereum is also trending higher. Currently, it is priced at $1,590. If the price manages to break below the first level of support at $1,585, we can observe the price moving towards the next price level at $1,491. Also, if price manages to break the second level, we can observe a further downside to the price level of $1,385.
On the upside, we can see resistance to the price action at levels $1,623, $1,647, and $1685. If the price of Ethereum manages to break the first level of resistance, we can see an upside price movement to the next level of resistance, as shown in the chart.
Solana Chart Analysis & SOLUSD Price Action.
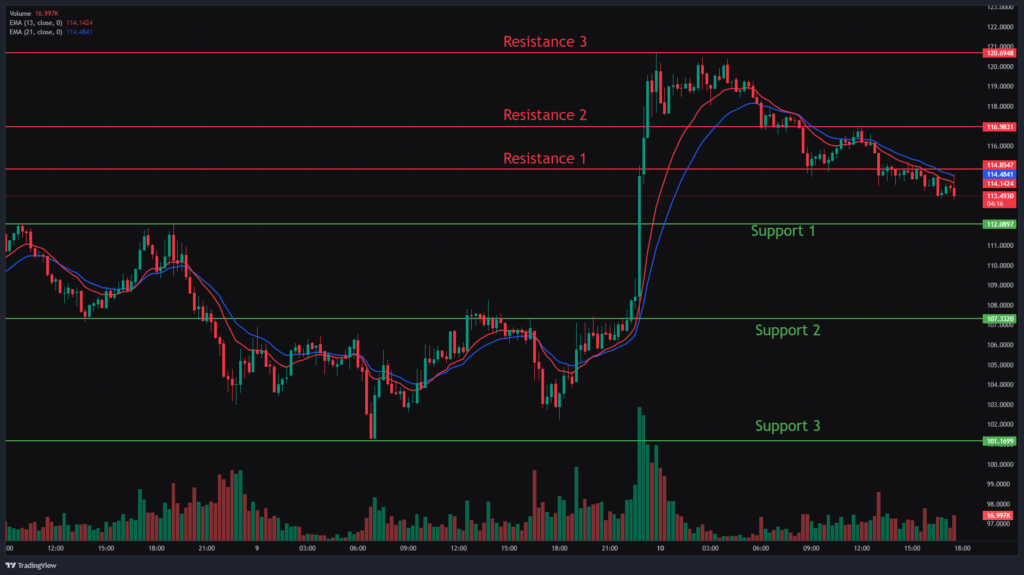
Solana price started a fresh increase after a sharp fall in the previous session. The coin is presently priced at $113.4. If the price manages to break the first level of support at $112.08, we can see a bearish trend. The next level of support is observed at $107.3. If the price fails to hold this level, we can observe a free fall to the next level at $101.1.
On the upside movements, we can observe key resistance levels at $114.8, $116.9 and $120.6. If price manages to break the first resistance levels, we can observe further price movements to the next resistance levels.
Trade setup Summary.
In the current market situation, it seems that the cryptocurrency market is likely to experience a bullish trend in the upcoming trading sessions. If the price of the cryptocurrency successfully breaks through the resistance levels, we can expect a stronger upward trend. However, if the resistance levels are not breached, the market may enter a range-bound trading session.
Traders should consider these key support and resistance levels of Bitcoin, Ethereum & Solana Price Action to enter long or short positions following the price break from the key levels. Also, traders can combine moving averages for more accurate entry and exit points.
Note: Our Daily Crypto Market Analysis and Trade Setup is published every day at 6:00 PM IST on 72crypto.Com.
