

Bitcoin and other cryptocurrencies turned green after a price correction that lasted a few days. The positive developments on the US-China Trade war fueled the crypto market to trade higher. Ahead of this rally, the global cryptocurrency market capitalisation has increased by 0.6% over the past 24 hours, currently standing at $3.1 trillion.
In this overview, we will analyse the key technical levels and trend directions for Bitcoin, Ethereum, and Solana to monitor in the upcoming trading sessions.

Bitcoin is currently up by 3.5%, trading around $97,000. Ethereum is priced at $1,830, up by 3%, and Solana is up by 2.9%, currently priced at $147. Overall, most cryptocurrencies are in green in the last 24 hours.
Now let’s understand the key support and resistance levels of Bitcoin, Ethereum and Solana and discuss the potential trading strategies for the next trading session. All charts mentioned below are based on the 15-minute timeframe.
Bitcoin Chart Analysis & BTCUSD Price Action.
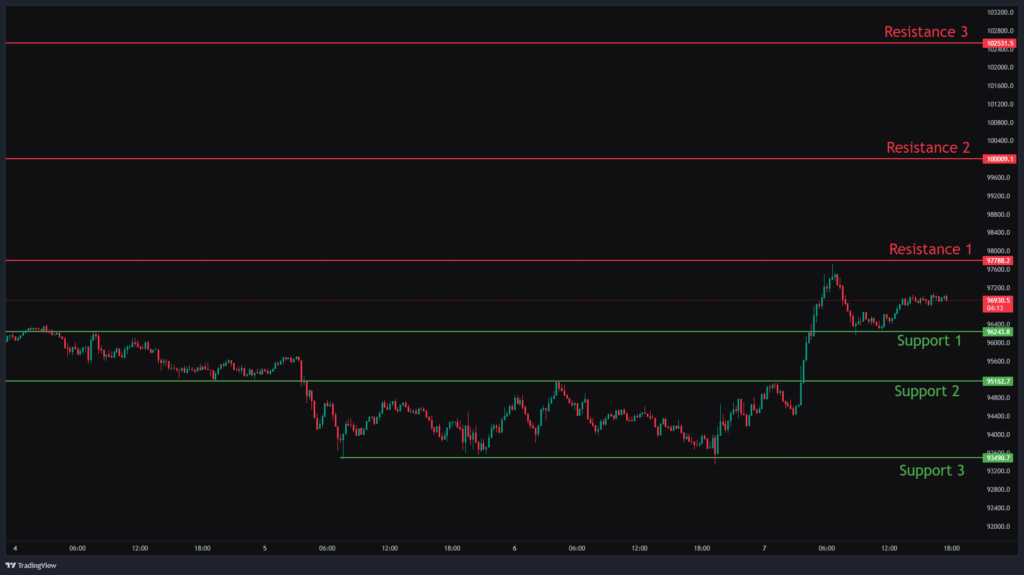
Bitcoin is currently trading around $97,000, inching towards $100,000 with a first level of support at $96,243. If the price manages to break this level, we can see a downfall to the next support at $95,168, and a decline in price below this level will push the price to fall to the price level at $93,490.
On the upside, we can see in the chart that the first level of resistance is at $97,788, followed by the next resistance at $100,000 and $91,02,531. If the price manages to break above this level, we can observe a good price movement upside. As the 1st resistance level is broken, we can observe the strong bullish movement.
Ethereum Chart Analysis & ETHUSD Price Action.
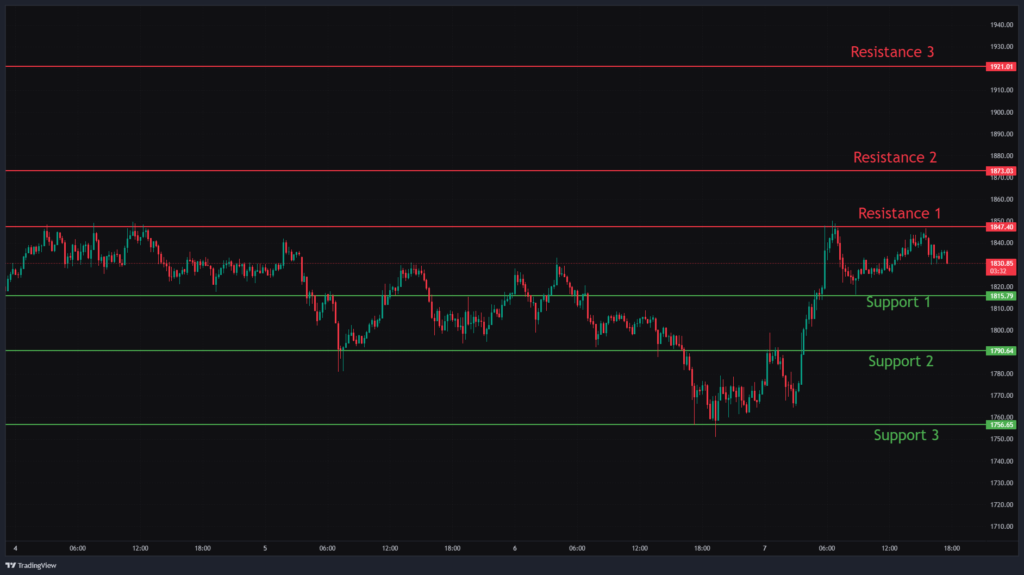
Ethereum is currently priced at $1,830. If the price manages to break below the first level of support at $1,815, we can observe the price moving towards the next price level at $1,790 and $1,756. Also, if price manages to break these levels, we can observe a further downside.
On the upside, we can see resistance to the price action at levels $1,847, $1,873, and $1,921. If the price of Ethereum manages to break the first level of resistance, we can see an upside price movement to the next level of resistance, as shown in the chart.
Solana Chart Analysis & SOLUSD Price Action.
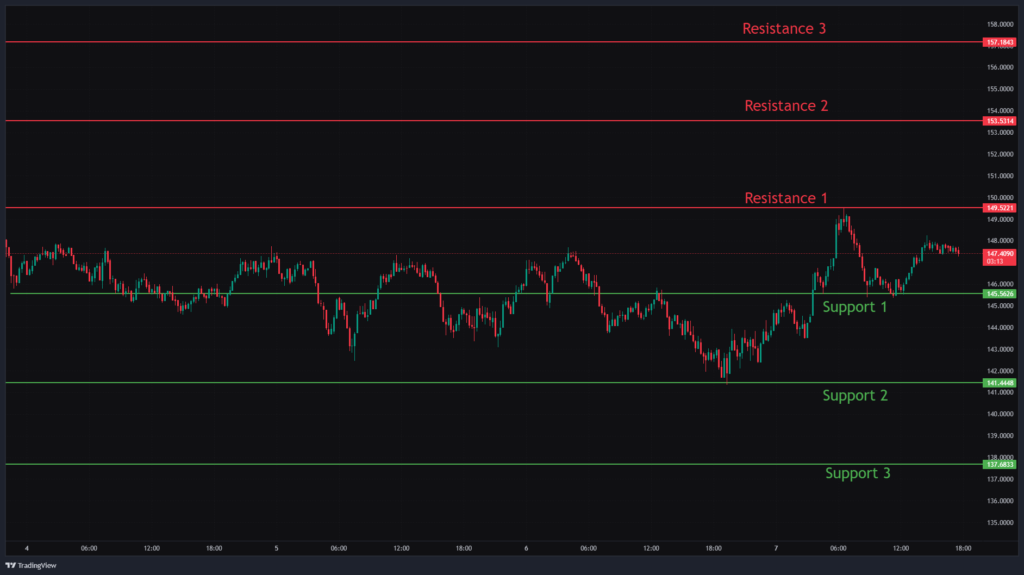
Solana’s price had seen a strong uptrend price action in the previous trading session. The coin is presently priced at $147.4. If the price manages to break the first level of support at $145.5, we can see a bearish trend. The next level of support is observed at $141.4. If the price fails to hold this level, we can observe a free fall to the next support to 137.6.
On the upside movements, we can observe key resistance levels at $149, $153.5 and $157.1. If price manages to break the first resistance levels, we can observe further price movements to the next resistance levels.
Trade setup Summary.
Currently, the cryptocurrency market is experiencing a bullish momentum. If the price of the cryptocurrency successfully breaks through these resistance levels, we can anticipate a stronger upward trend. However, if the resistance levels remain intact, the market may shift into a bearish trading session.
Traders should consider these key support and resistance levels to enter long or short positions following the price break from the key levels. Also, traders can combine moving averages for more accurate entry and exit points.
Note: Our Daily Crypto Market Analysis and Trade Setup is published every day at 6:00 PM IST on 72crypto.Com.

